Consumer Price Index, July 2025
This monthly release of the The Consumer Price Index (CPI) for Canada, the provinces, Whitehorse and Yellowknife, provides a descriptive summary of retail price movements, inflation rates and the factors underlying them.
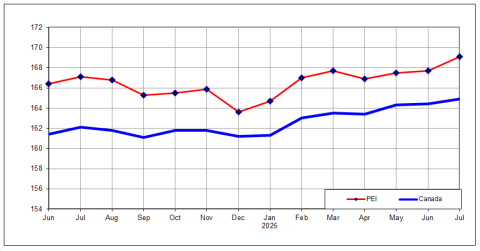
PEI and Canada Consumer Price Index
All-Items Consumer Price Index by Province
| CA | NL | PE | NS | NB | QC | ON | MB | SK | AB | BC | |
| Jul-25 | 164.9 | 165.7 | 169.1 | 168.6 | 164.7 | 161.6 | 166.5 | 165.3 | 165.9 | 172.6 | 159.1 |
| Jun-25 | 164.4 | 164.4 | 167.7 | 167.7 | 164.0 | 161.0 | 166.0 | 164.3 | 165.5 | 172.3 | 158.8 |
| Jul-24 | 162.1 | 163.1 | 167.1 | 165.9 | 162.9 | 157.9 | 163.9 | 162.2 | 163.6 | 170.4 | 156.4 |
| Year Over year Change (%) | 1.7% | 1.6% | 1.2% | 1.6% | 1.1% | 2.3% | 1.6% | 1.9% | 1.4% | 1.3% | 1.7% |
| Monthly Change (%) | 0.3% | 0.8% | 0.8% | 0.5% | 0.4% | 0.4% | 0.3% | 0.6% | 0.2% | 0.2% | 0.2% |
Statistics Canada reported that the year-over-year change in the All-Items Consumer Price Index (CPI) for P.E.I. was 1.2 percent in July 2025, the second lowest year-over-year increase among provinces. This is up from 0.8 percent in June. Year-over-year prices rose at a slower pace in July than in June in 6 provinces. The change to the All-items index for P.E.I. as compared to June 2025 was 0.8 percent. This compares to 1.7 percent year-over-year and 0.3 percent monthly changes for Canada.
Leading contributors to year-over-year price increases for P.E.I. were rent (5.6%), followed by purchase and leasing of passenger vehicles (4.3%), food purchased from restaurants (3.8%), passenger vehicle insurance premiums (9.8%), and recreational equipment and services excluding recreational vehicles (7.3%). These increases were partially offset by year-over-year declines for gasoline (-16.4%), traveler accommodation (-18.2%), inter-city transportation (-11.3%), fuel oil and other fuels (-6.9%), and purchase and operation of recreational vehicles (-3.1%).
The monthly change in the All-Items CPI for PEI in July 2025 was 0.8 percent. Higher prices for traveler accommodation (22.0%), fuel oil and other fuels (8.7%), inter-city transportation (7.7%), passenger vehicle parts, maintenance and repairs (2.2%), and telephone services (3.5%) were partially offset by lower prices for women's clothing (-3.2%), travel tours1, non-prescribed medicines (-3.5%), fresh or frozen pork (-12.2%), and bakery products (-1.5%).
Prices increased year-over-year in 6 of the 8 major CPI components, led by 3.3 percent increase in food prices and a 2.4 percent increase in alcohol, tobacco, and cannabis prices. Energy2 costs fell 11.6 percent year-over-year.
The cost of food increased 3.3 percent year-over-year in July, up from a 3.0 percent increase in June. Food purchased from restaurants was up 3.8 percent year-over-year in July, while food purchased from stores increased 3.1 percent. Prices for fish, seafood and other marine products (2.8%), fruit, fruit preparations and nuts (3.8%), vegetables and vegetable preparations (0.2%), and other food products and non-alcoholic beverages (7.9%) rose at a faster pace in July than in June. Prices for dairy products and eggs (-2.0%) and bakery and cereal products excluding baby food (-0.8%) declined year-over-year, while prices for meat (5.5%) rose at a slower pace than one month ago.
July 2025 Prince Edward Island CPI, Eight Major Components and Energy
| Prince Edward Island CPI Major Components and Energy | |||||||||
| Food | Household operations, furnishings & equipment | Shelter | Clothing & Footwear | Transportation | Health & Personal Care | Recreation, Education, & Reading | Alcohol, Tobacco, & Cannibis | Energy | |
| Jul-25 | 211.1 | 142.0 | 180.1 | 98.6 | 174.3 | 159.0 | 133.6 | 237.6 | 226.5 |
| Jun-25 | 209.6 | 140.6 | 178.3 | 100.6 | 172.8 | 159.5 | 130.7 | 237.1 | 223.5 |
| Jul-24 | 204.3 | 139.1 | 176.4 | 99.6 | 179.6 | 156.2 | 131.4 | 232.0 | 256.2 |
| Year Over year Change (%) | 3.3% | 2.1% | 2.1% | -1.0% | -3.0% | 1.8% | 1.7% | 2.4% | -11.6% |
| Monthly Change (%) | 0.7% | 1.0% | 1.0% | -2.0% | 0.9% | -0.3% | 2.2% | 0.2% | 1.3% |
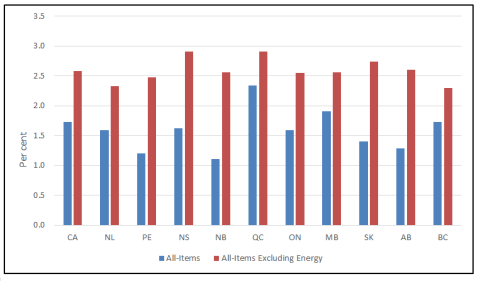
Excluding energy, PEI’s CPI increased 2.5 percent year-over-year, the third lowest among provinces along with Ontario, also at 2.5 percent. The year-over-year increase in the All-items excluding energy index for Canada was 2.6 percent.
July 2025 CPI All-Items and All-Items Excluding Energy, Year-Over-Year Change, Canada and Provinces
NATIONAL
Nationally, the All-Items CPI rose 1.7 percent on a year-over-year basis in July, down from 1.9 percent in June. The slowdown was mainly due to a 16.1 percent year-over-year decline in gasoline prices, while faster price growth for food purchased from stores (3.4%) and a smaller year-over-year decline in natural gas prices (-7.3%) put upward pressure on the headline CPI.
Gasoline prices were down 16.1 percent year-over-year following a 13.4 percent decline in June. Year-over-year gasoline prices continue to reflect the removal of the federal consumer carbon tax. As compared to one month ago, gasoline prices fell 0.7 percent. Lower crude oil prices and increased supply from the Organization of the Petroleum Exporting Countries and its partners (OPEC+) contributed to the decline.
Year-over-year prices increased in seven of the eight major components and rose at a faster pace in July as compared to June in three components.
On a monthly basis nationally, the All-Items CPI increased 0.3 percent in July, following a 0.1 percent increase in June.
For more information on the June 2025 CPI, as well as links to data tables, please refer to Statistics Canada’s release for the Consumer Price Index, July 2025.
Related downloads for this release:
Monthly Consumer Price Index Report PDF (87KB)
1 Data not published at the provincial level
2 The special aggregate "energy" includes: "electricity", "natural gas", "fuel oil and other fuels", "gasoline", and "fuel, parts and accessories for recreational vehicles".
Visit the Consumer Price Index Portal to find all CPI data, publications, interactive tools, and announcements highlighting new products and upcoming changes to the CPI in one convenient location.
The CPI for August 2025 will be released on September 16, 2025.
Source: Statistics Canada.
Table 18-10-0004-01, Consumer Price Index, monthly, not seasonally adjusted